We monitor & automate your energy
Most estates pay for energy they can't see. SIG makes every kilowatt of electricity, gas, water and solar visible — then our own engineers act on the waste. Retrofitted to plant of any age, with savings of up to 40%.
Free & no obligation · No rip-and-replace · Reply within 1 working day
Trusted across thousands of homes, factories, schools & more — monitoring electric, gas, water & solar
You can't cut what you can't see
Quarterly bills and manual meter readings hide where the money really goes. By the time a spike shows up on an invoice, you've already paid for months of waste.
Invisible waste
Boilers and plant left running overnight, at weekends and through the holidays — quietly adding thousands to the bill with no one watching.
Guesswork, not data
Manual readings and a single quarterly figure can't tell you which site, meter or supply is driving cost — so savings are a shot in the dark.
Reacting to bills
Without sub-hourly, multi-utility data, you find out about a problem when the invoice lands — never in time to stop it.
SIG closes the gap — making every utility visible in real time, then acting on the waste for you. See how →
One partner, from data to delivery
We manage projects end-to-end with our own engineers, then give your team the information and control you need from any web-enabled device.
Monitor
Real-time access to utilities, energy and carbon data via SIG — so you understand exactly how your estate uses energy.
Analyse
Year-on-year trends, automatic anomaly flagging and email alerts for usage spikes — highlighting savings before the bill arrives.
Control
Retrofitted control devices for high-energy plant — air handling units, lighting and heating — to take back command of consumption.
Save
Evidence-led measures — voltage optimisation, power factor correction and plant fixes — delivering savings of up to 40%.
Everything we do, under one roof
From the first sub-meter to optimised plant, our own engineers deliver the complete service — so you can monitor, understand and cut your energy spend.
Energy monitoring & sub-metering
SIG Insight gives real-time access to utilities, energy and carbon data — so you understand your usage and make informed decisions to cut cost and carbon.
Gas, heat & water monitoring
Energy isn't the only resource that matters. We help you see how gas, heat and water are used across your facility — arming you with the data to cut waste and save money.
Power quality monitoring
Not all energy is created equally. Unbalanced load, poor voltage or power factor issues can waste thousands a year — our analysis targets cost-effective fixes worth up to 40%.
Electrical system optimisation
An end-to-end solution — from reports for the business case through to installing the equipment on site and overcoming every practical challenge along the way.
Alternative power solutions
Renewables can be revolutionary for both cost and net zero. The first step is understanding what and how you currently use energy — and we help you on that journey.
Targeted savings
The SIG platform turns remotely gathered data into meaning — highlighting savings and year-on-year change so you take back control of your energy usage.
See everything. Miss nothing.
A single portal for your whole estate — with role-based access for finance, estates and site teams.
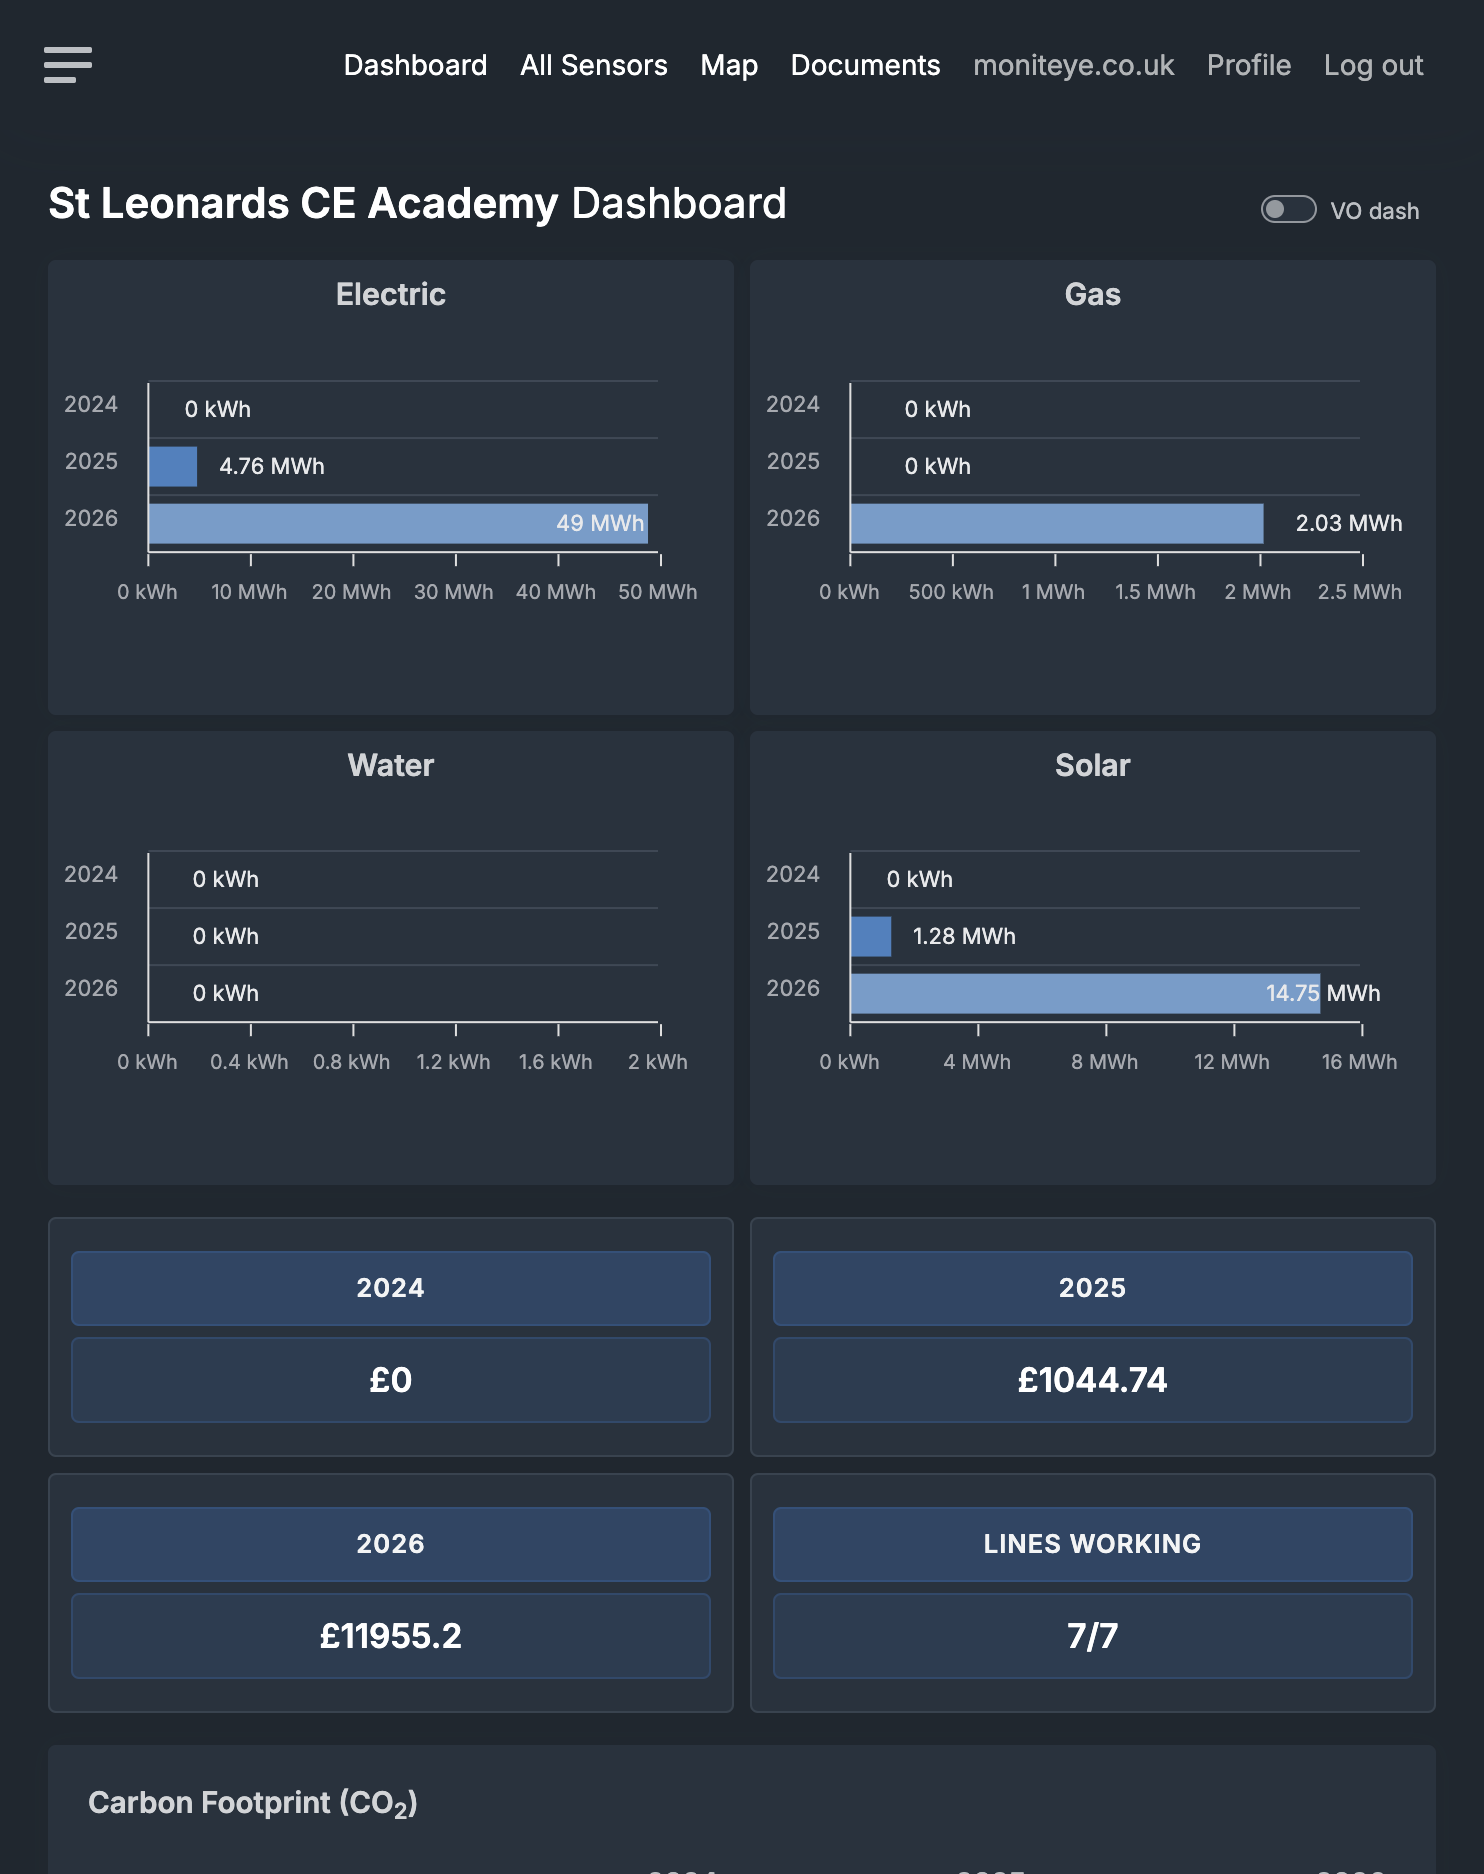
Every utility, on one screen
Electricity, gas, water and solar generation side by side, with year-on-year comparison, running cost and how many monitoring lines are live right now.
- Multi-utility totals & spend at a glance
- Switch instantly between every site in the estate
- No more manual meter readings
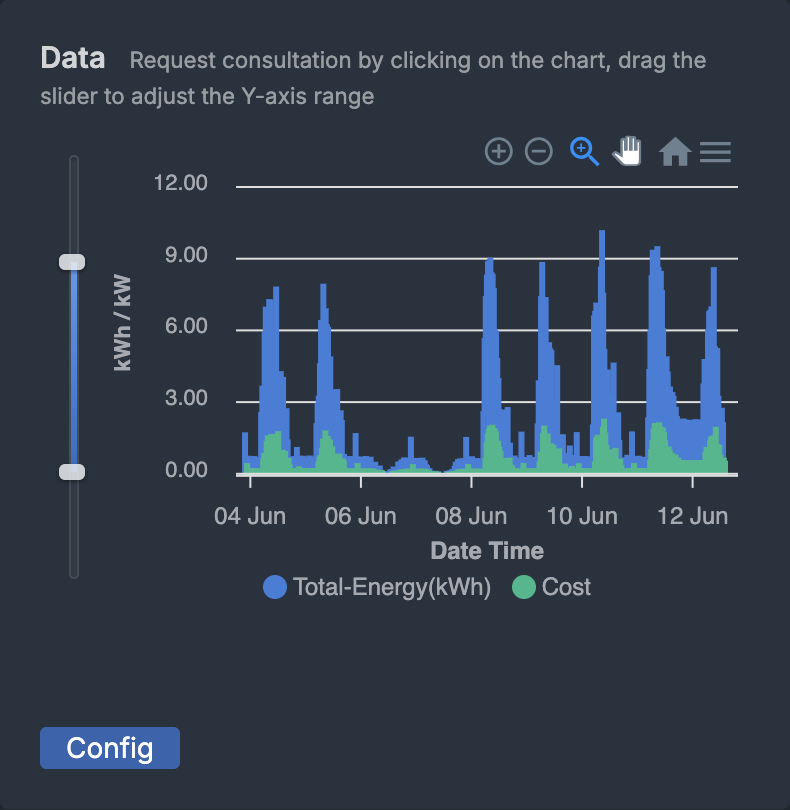
Half-hourly detail for every meter
Drill into any sensor to see the true load curve — the overnight baseload, the morning ramp, and out-of-hours use that quietly drives cost.
- Sub-hourly consumption for electric, gas, water & solar
- Spot plant left running at weekends & holidays
- Live readings table with exportable data
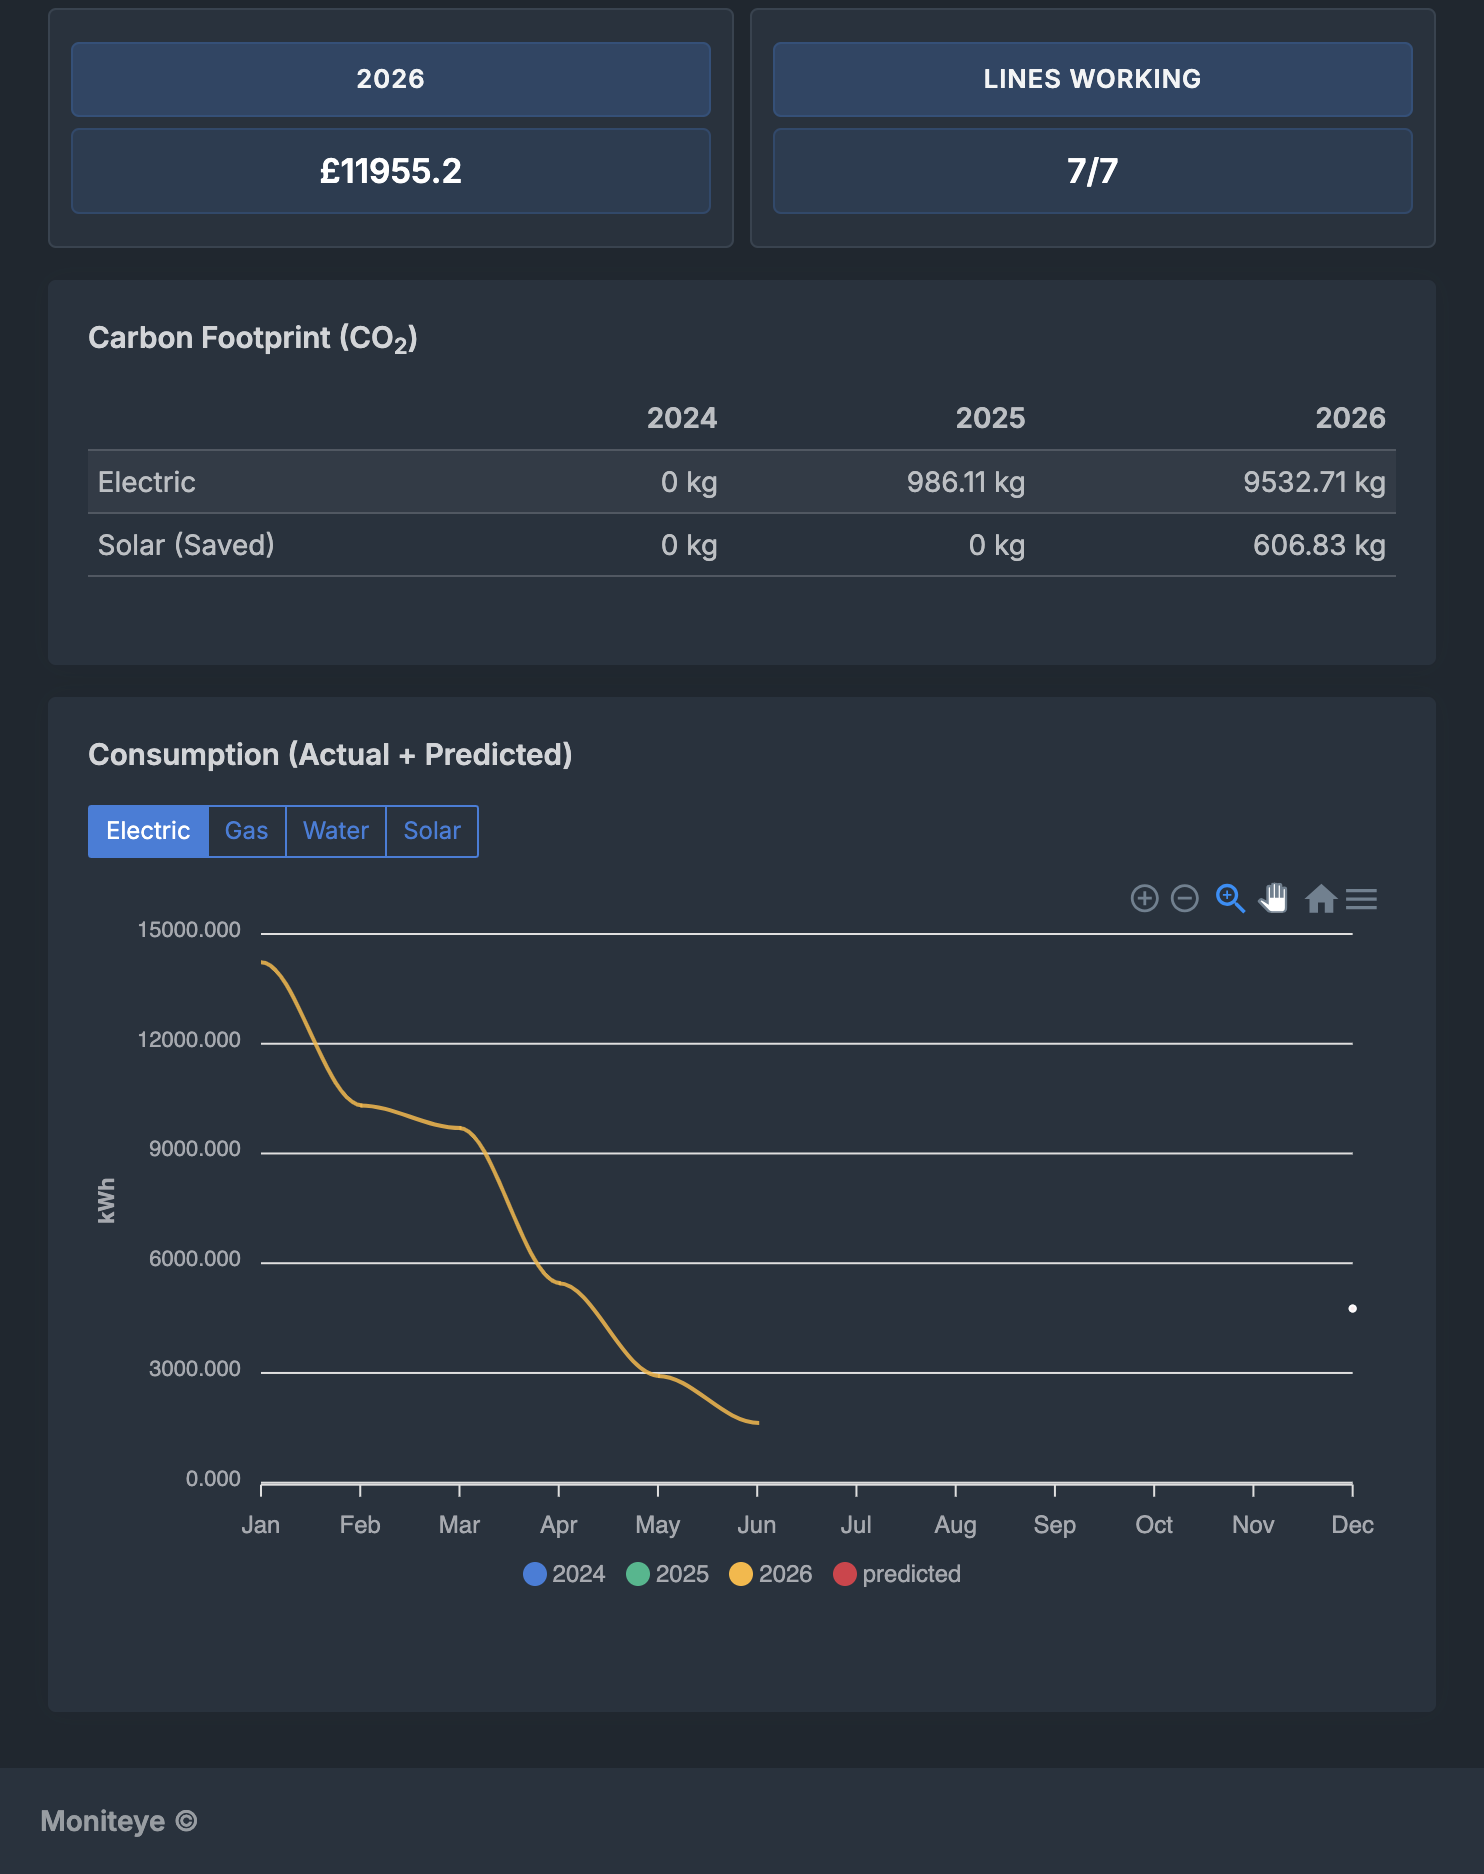
From consumption to carbon — and what comes next
Consistent utility and generation data rolls up into carbon reporting and an actual-plus-predicted forecast, giving boards and CFOs the evidence they need.
- CO₂ footprint by year, including solar offset
- Actual + predicted consumption forecasting
- Data ready for net-zero & sustainability reporting
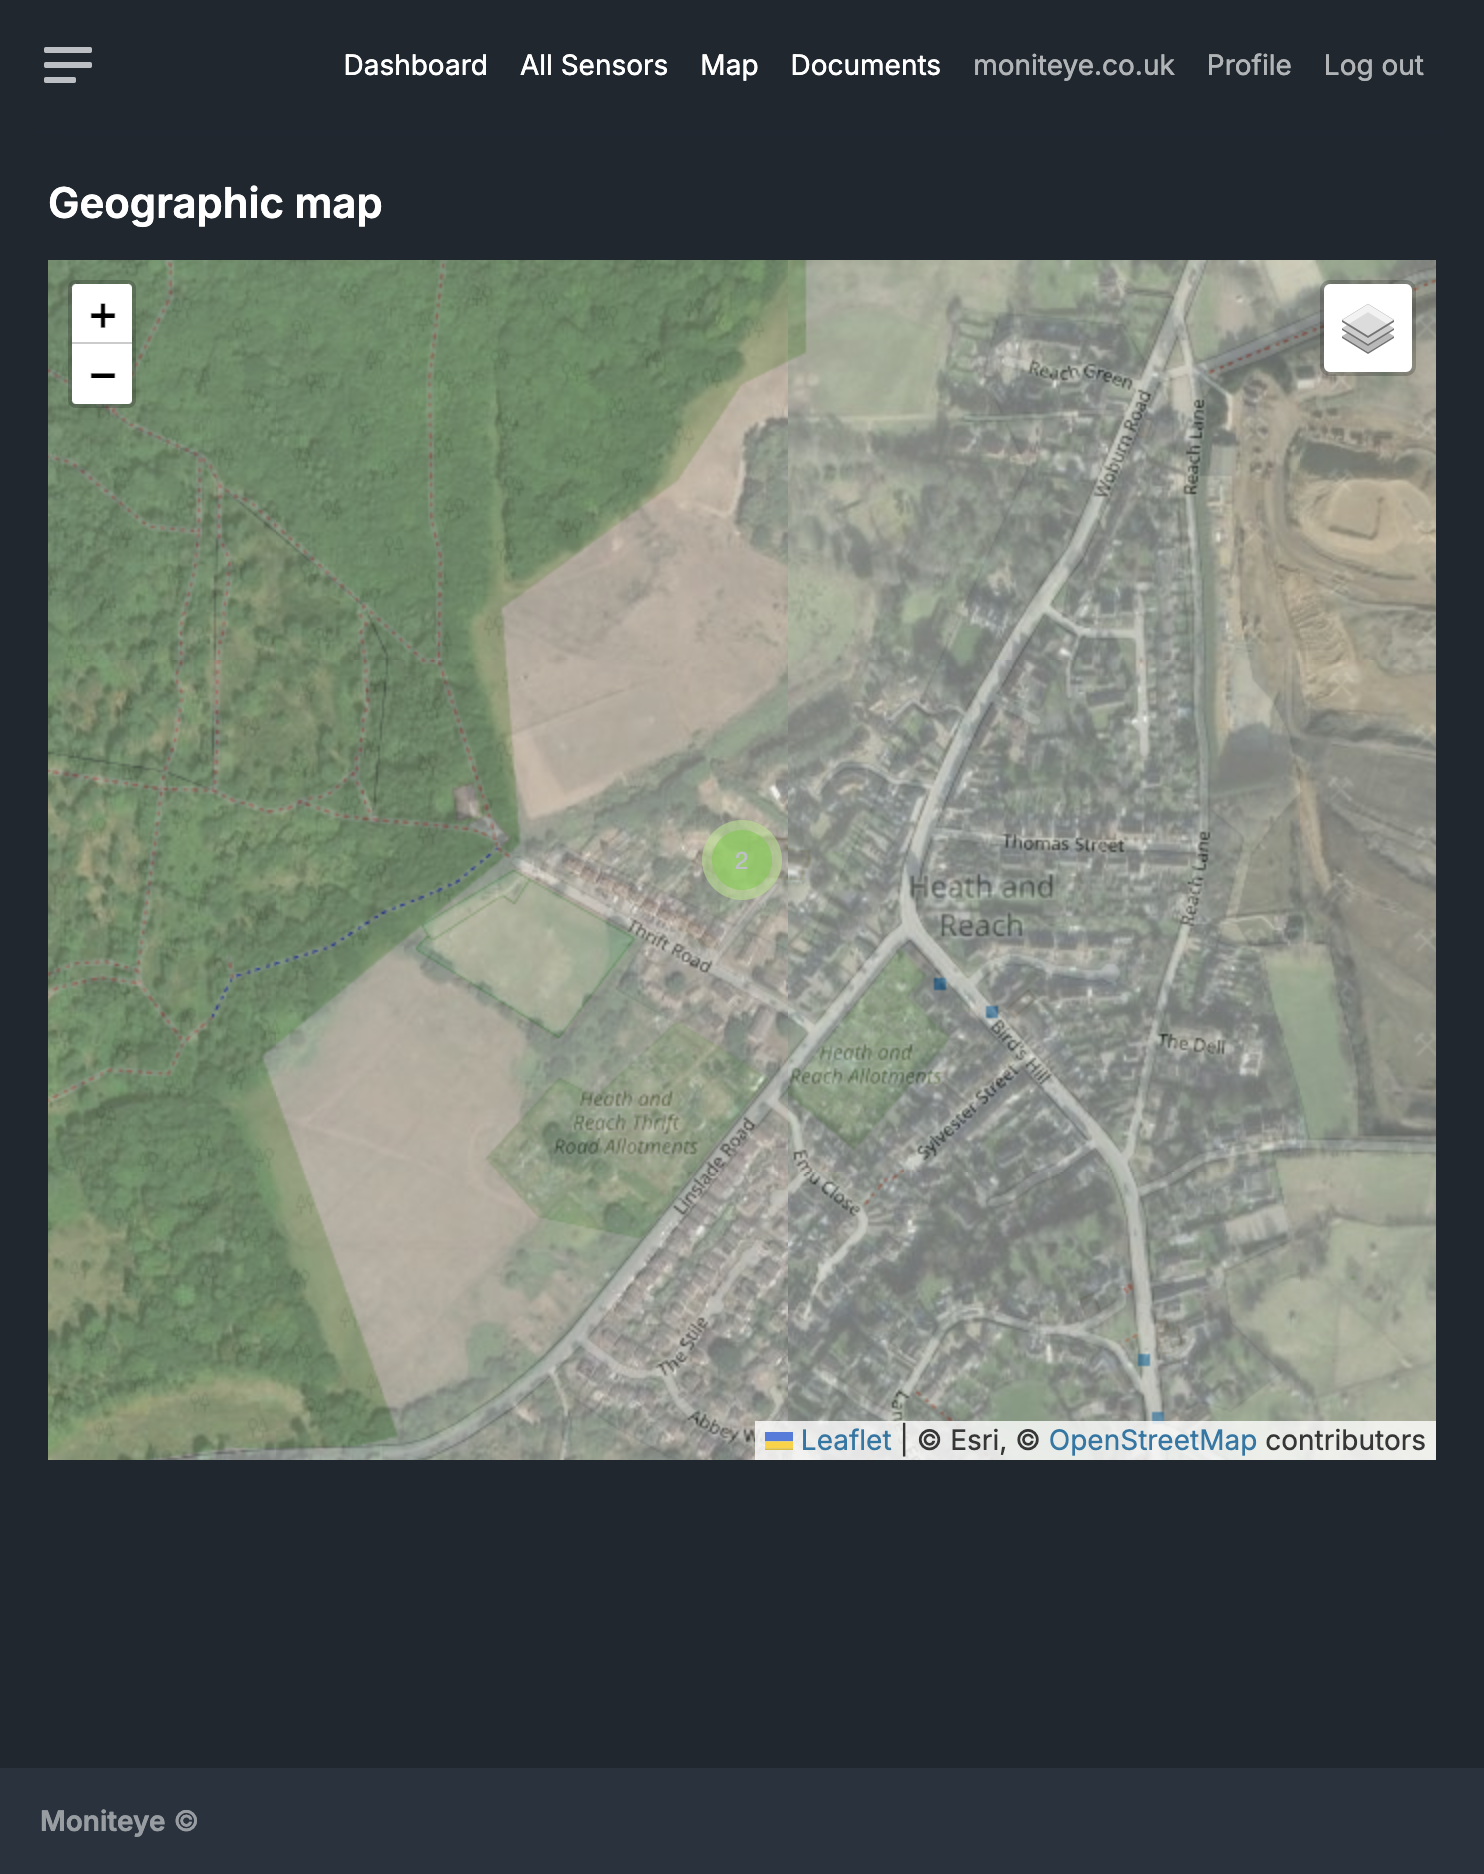
The whole estate, geographically
See every monitored site on one map, jump straight to a location, and let automatic trigger and action alerts surface anomalies before they become a big bill.
- Satellite & hybrid mapping of all sites
- Green / amber / red exception alerting
- Sub-metering for accurate sub-let recharging
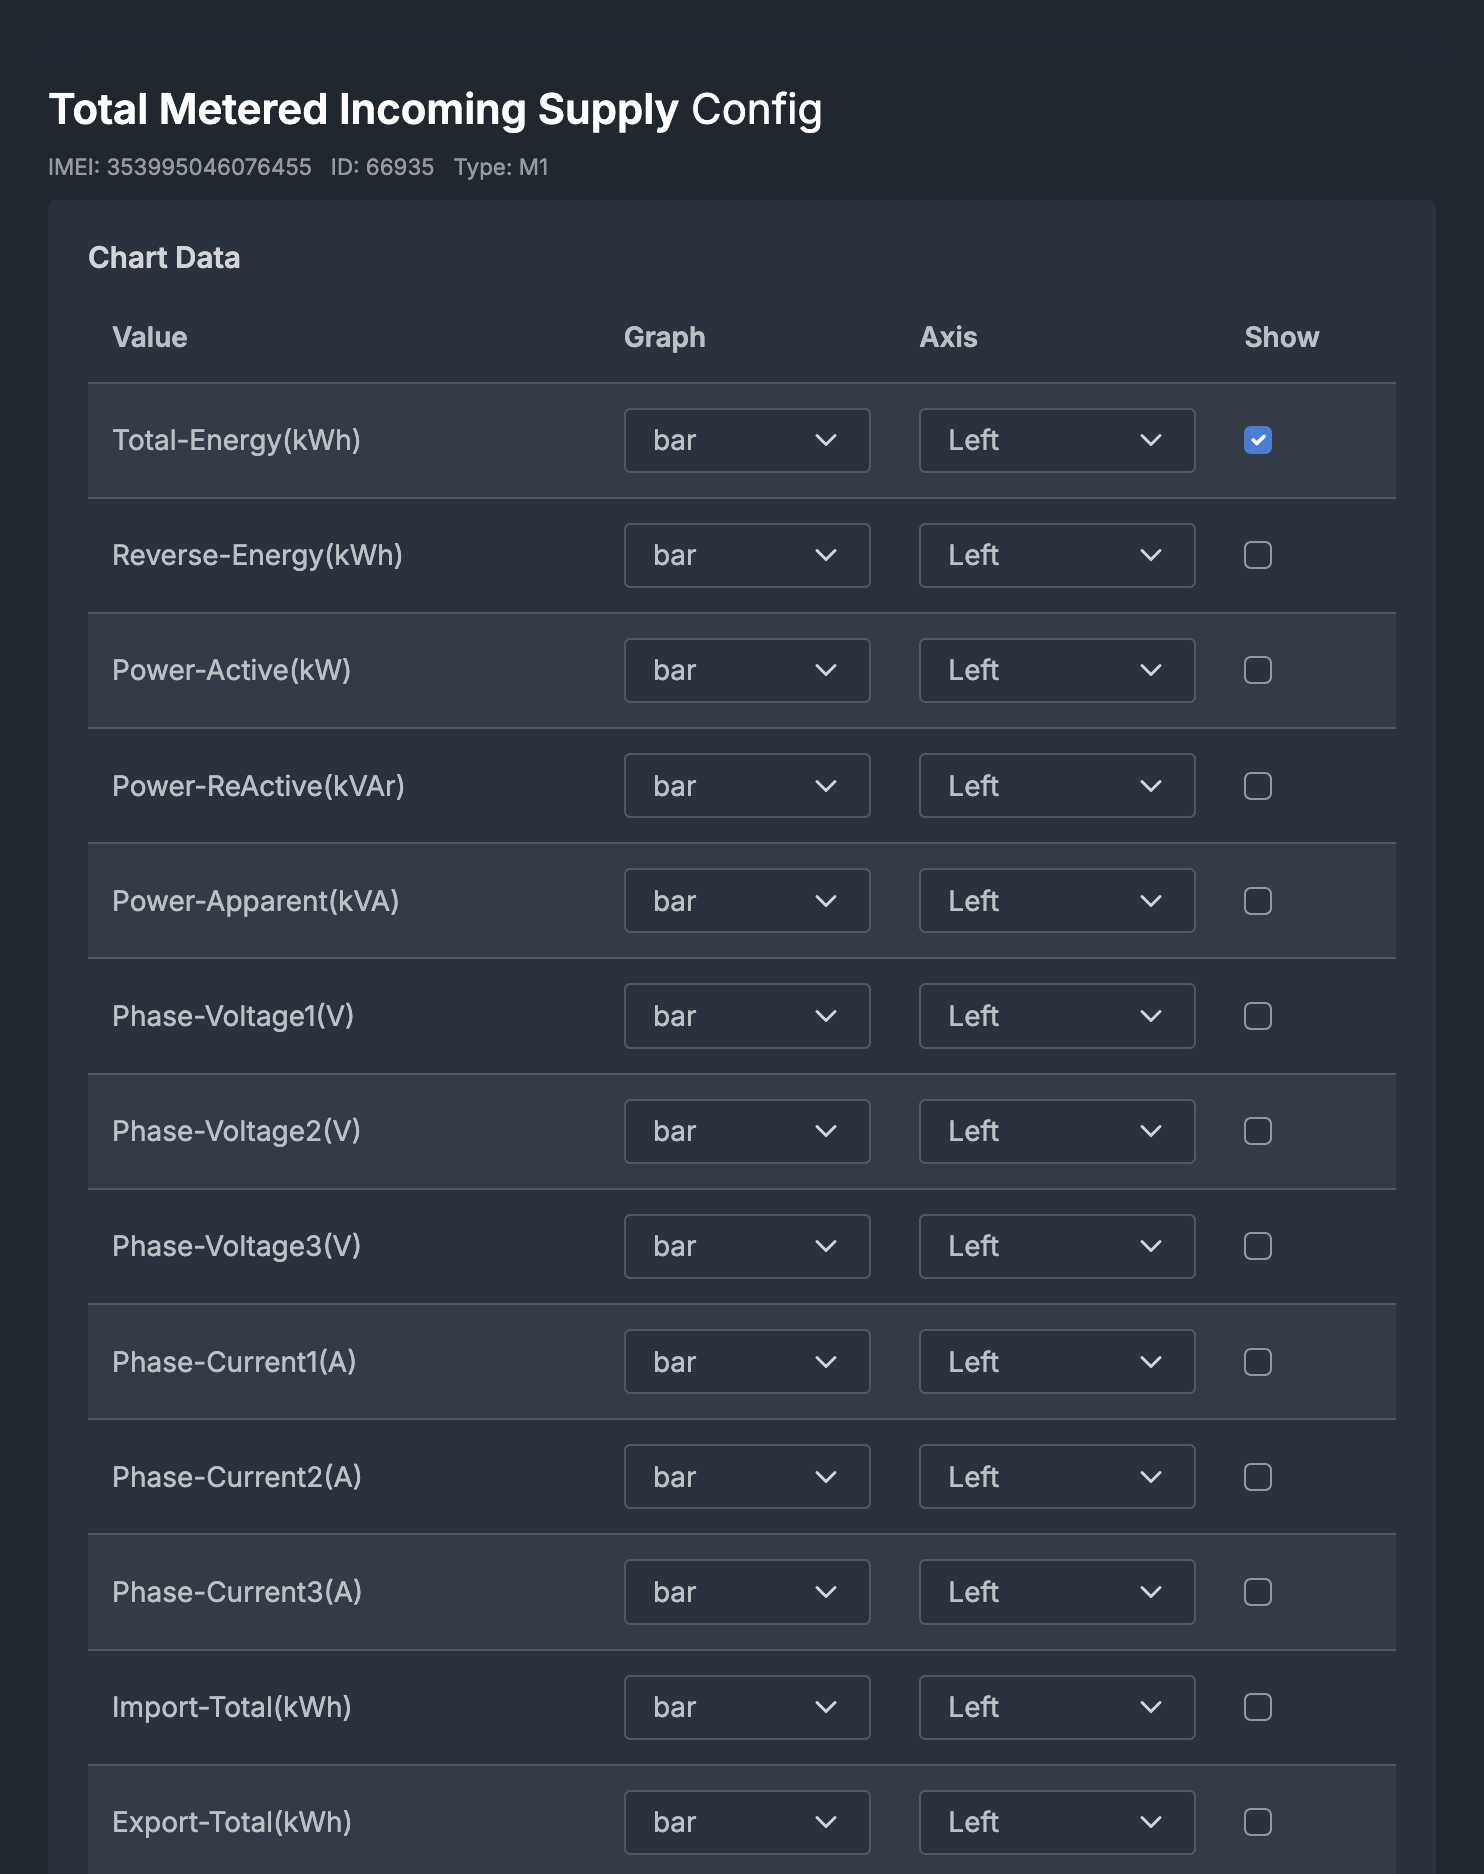
Tuned to your meters, tariffs & alerts
Each meter is configured to your estate — choose which channels to chart, set unit-price schedules and standing charges for accurate £ costing, and route email alerts to the right people.
- Full three-phase detail — power, voltage & current per channel
- Unit-price schedules, currency & daily standing charges
- Meter-reading offsets & scheduled email alerts
Analytics that do the digging for you
SIG goes beyond charts — surfacing baseload waste, daily patterns and weather links automatically, with the £ impact attached.
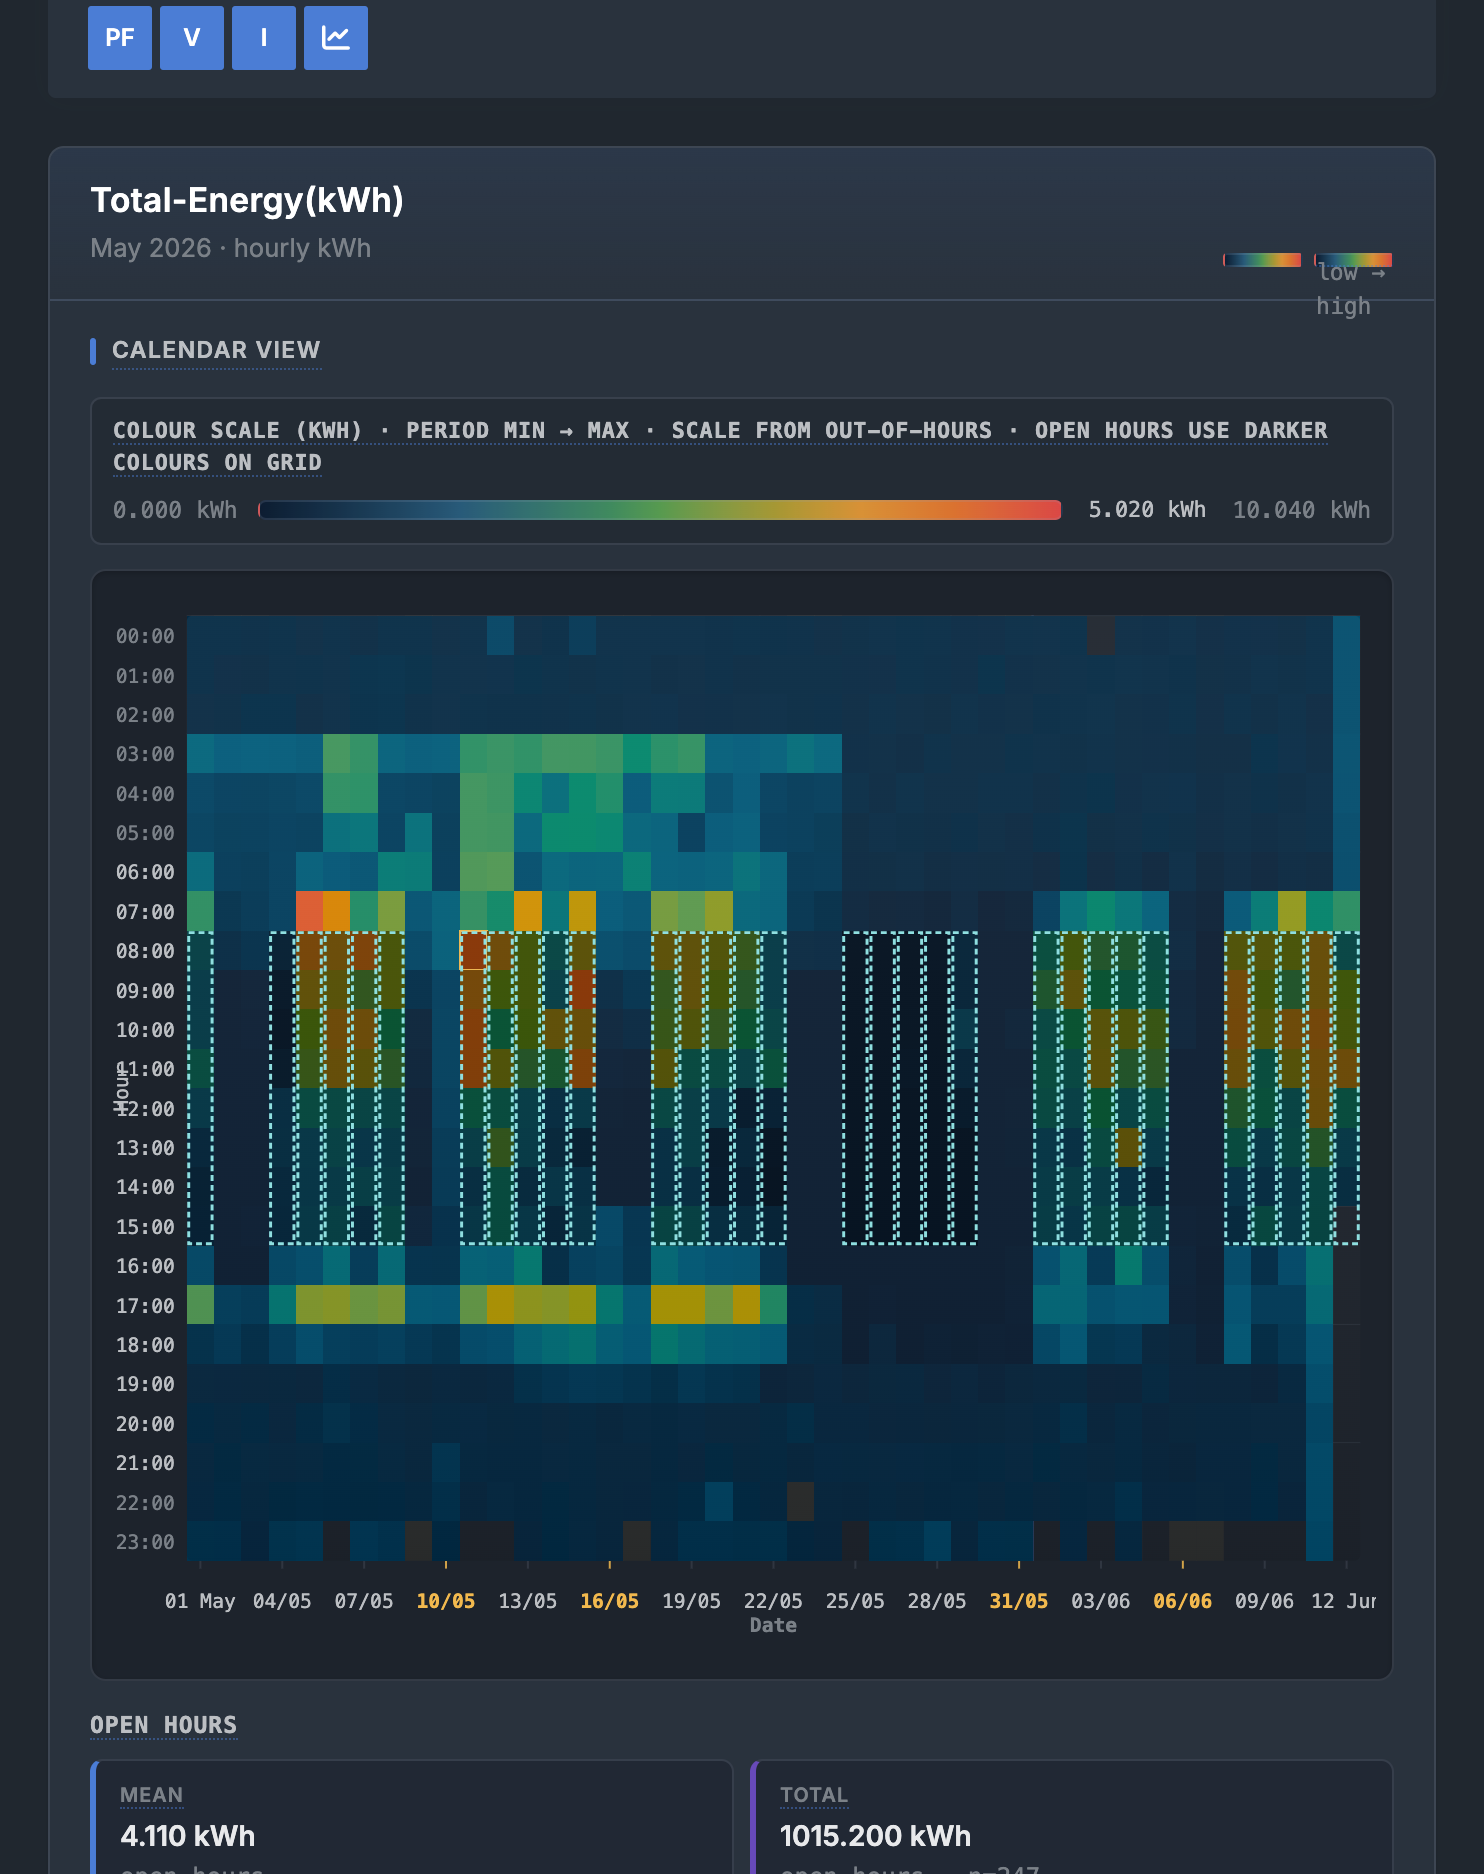
Spot patterns at a glance
An hour-by-day heatmap makes out-of-hours running, early starts and weekend waste jump straight out — with open-hours shaded against your real timetable.
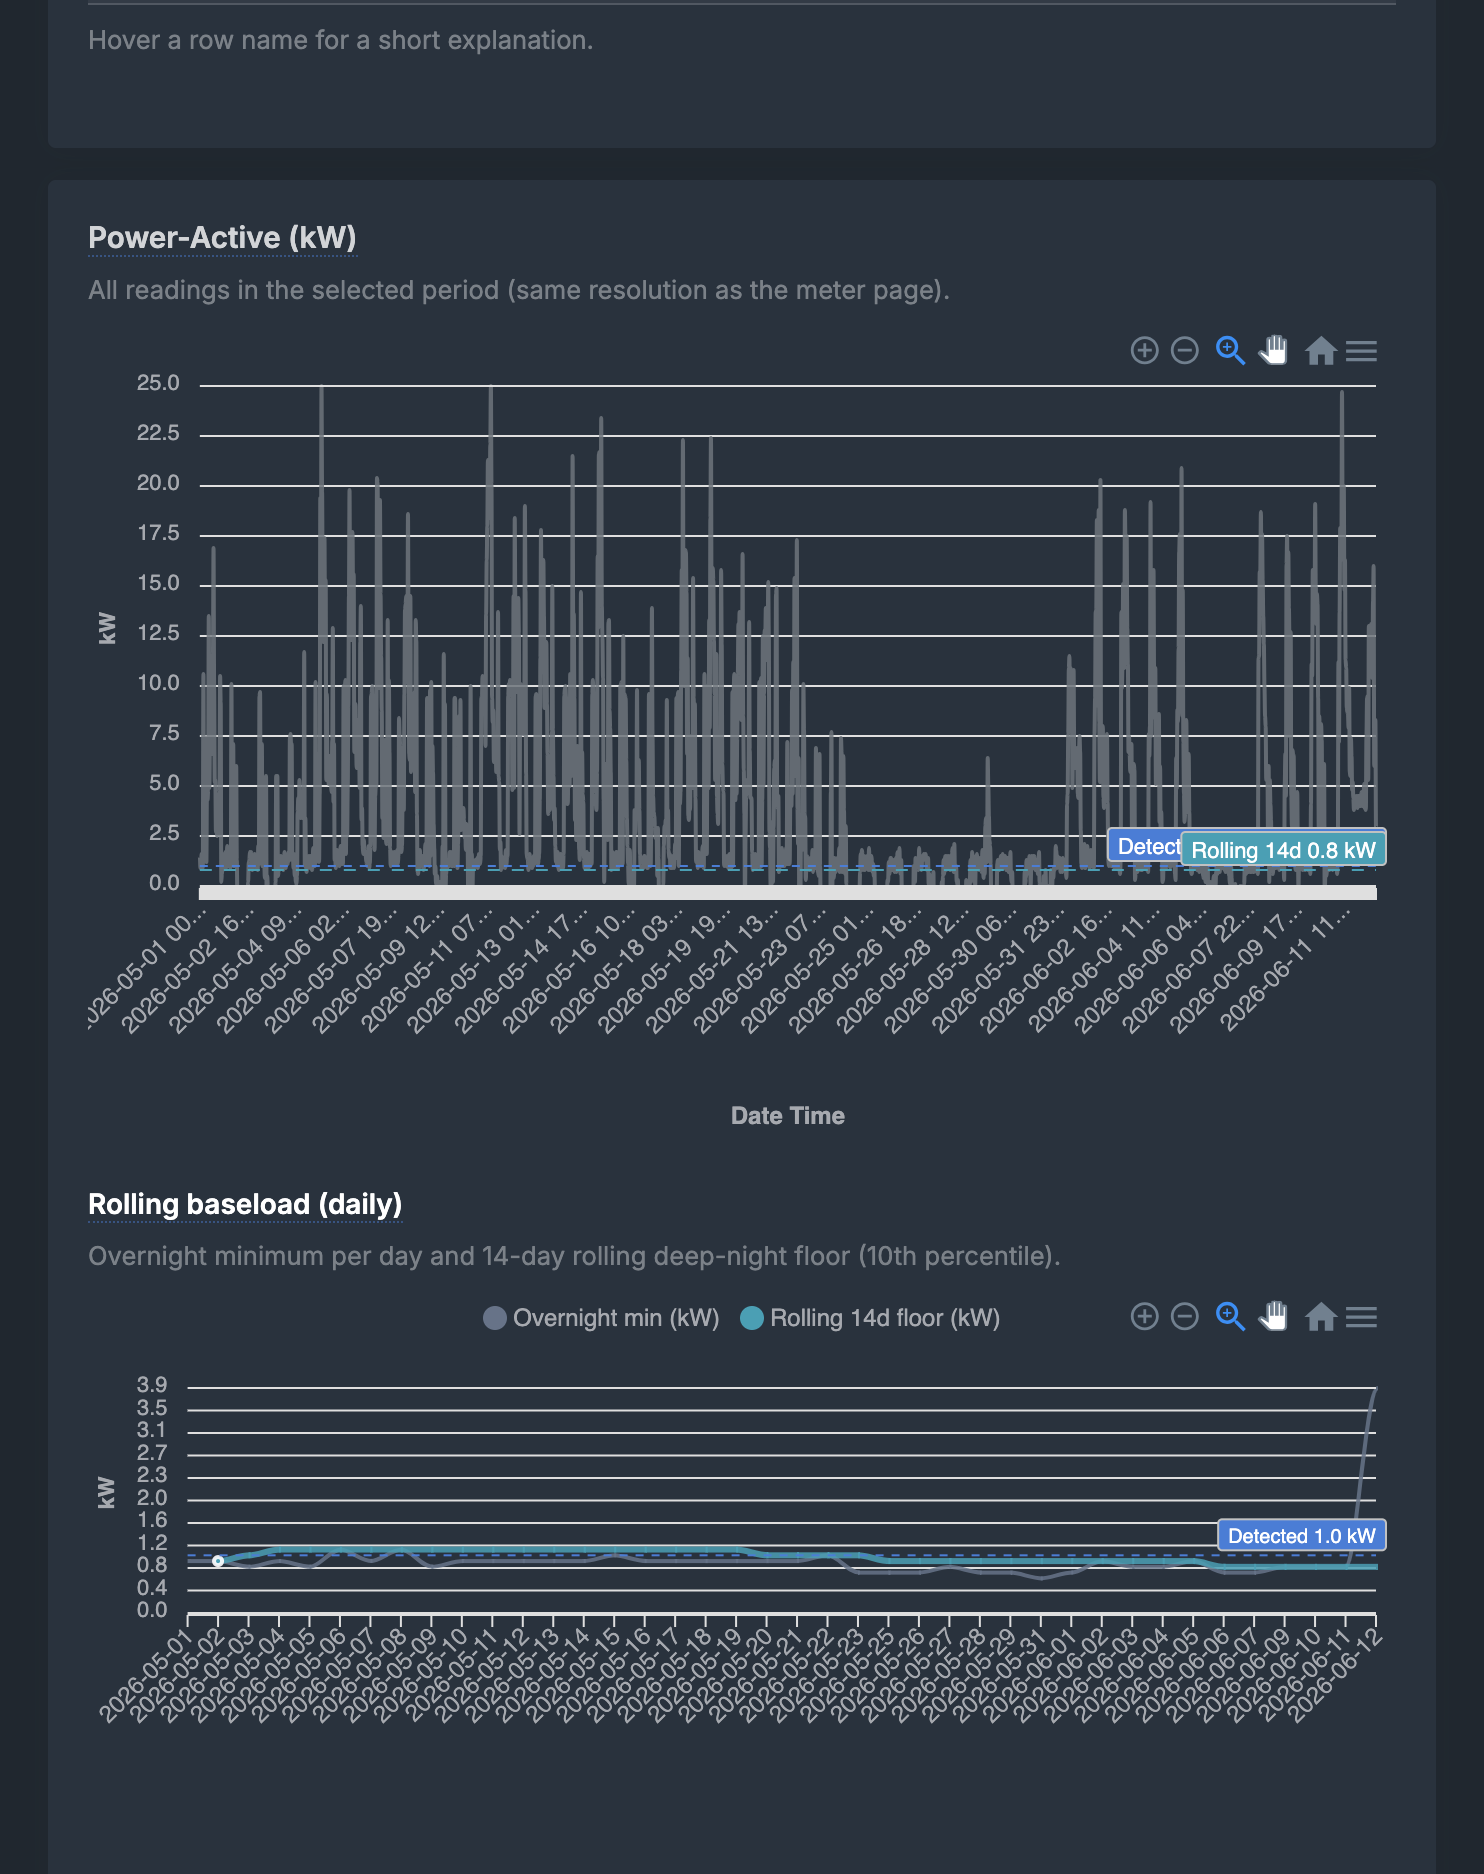
Find the savings overnight
We estimate your true overnight baseload, identify the best achievable shutdown night and rank actions by estimated annual impact.
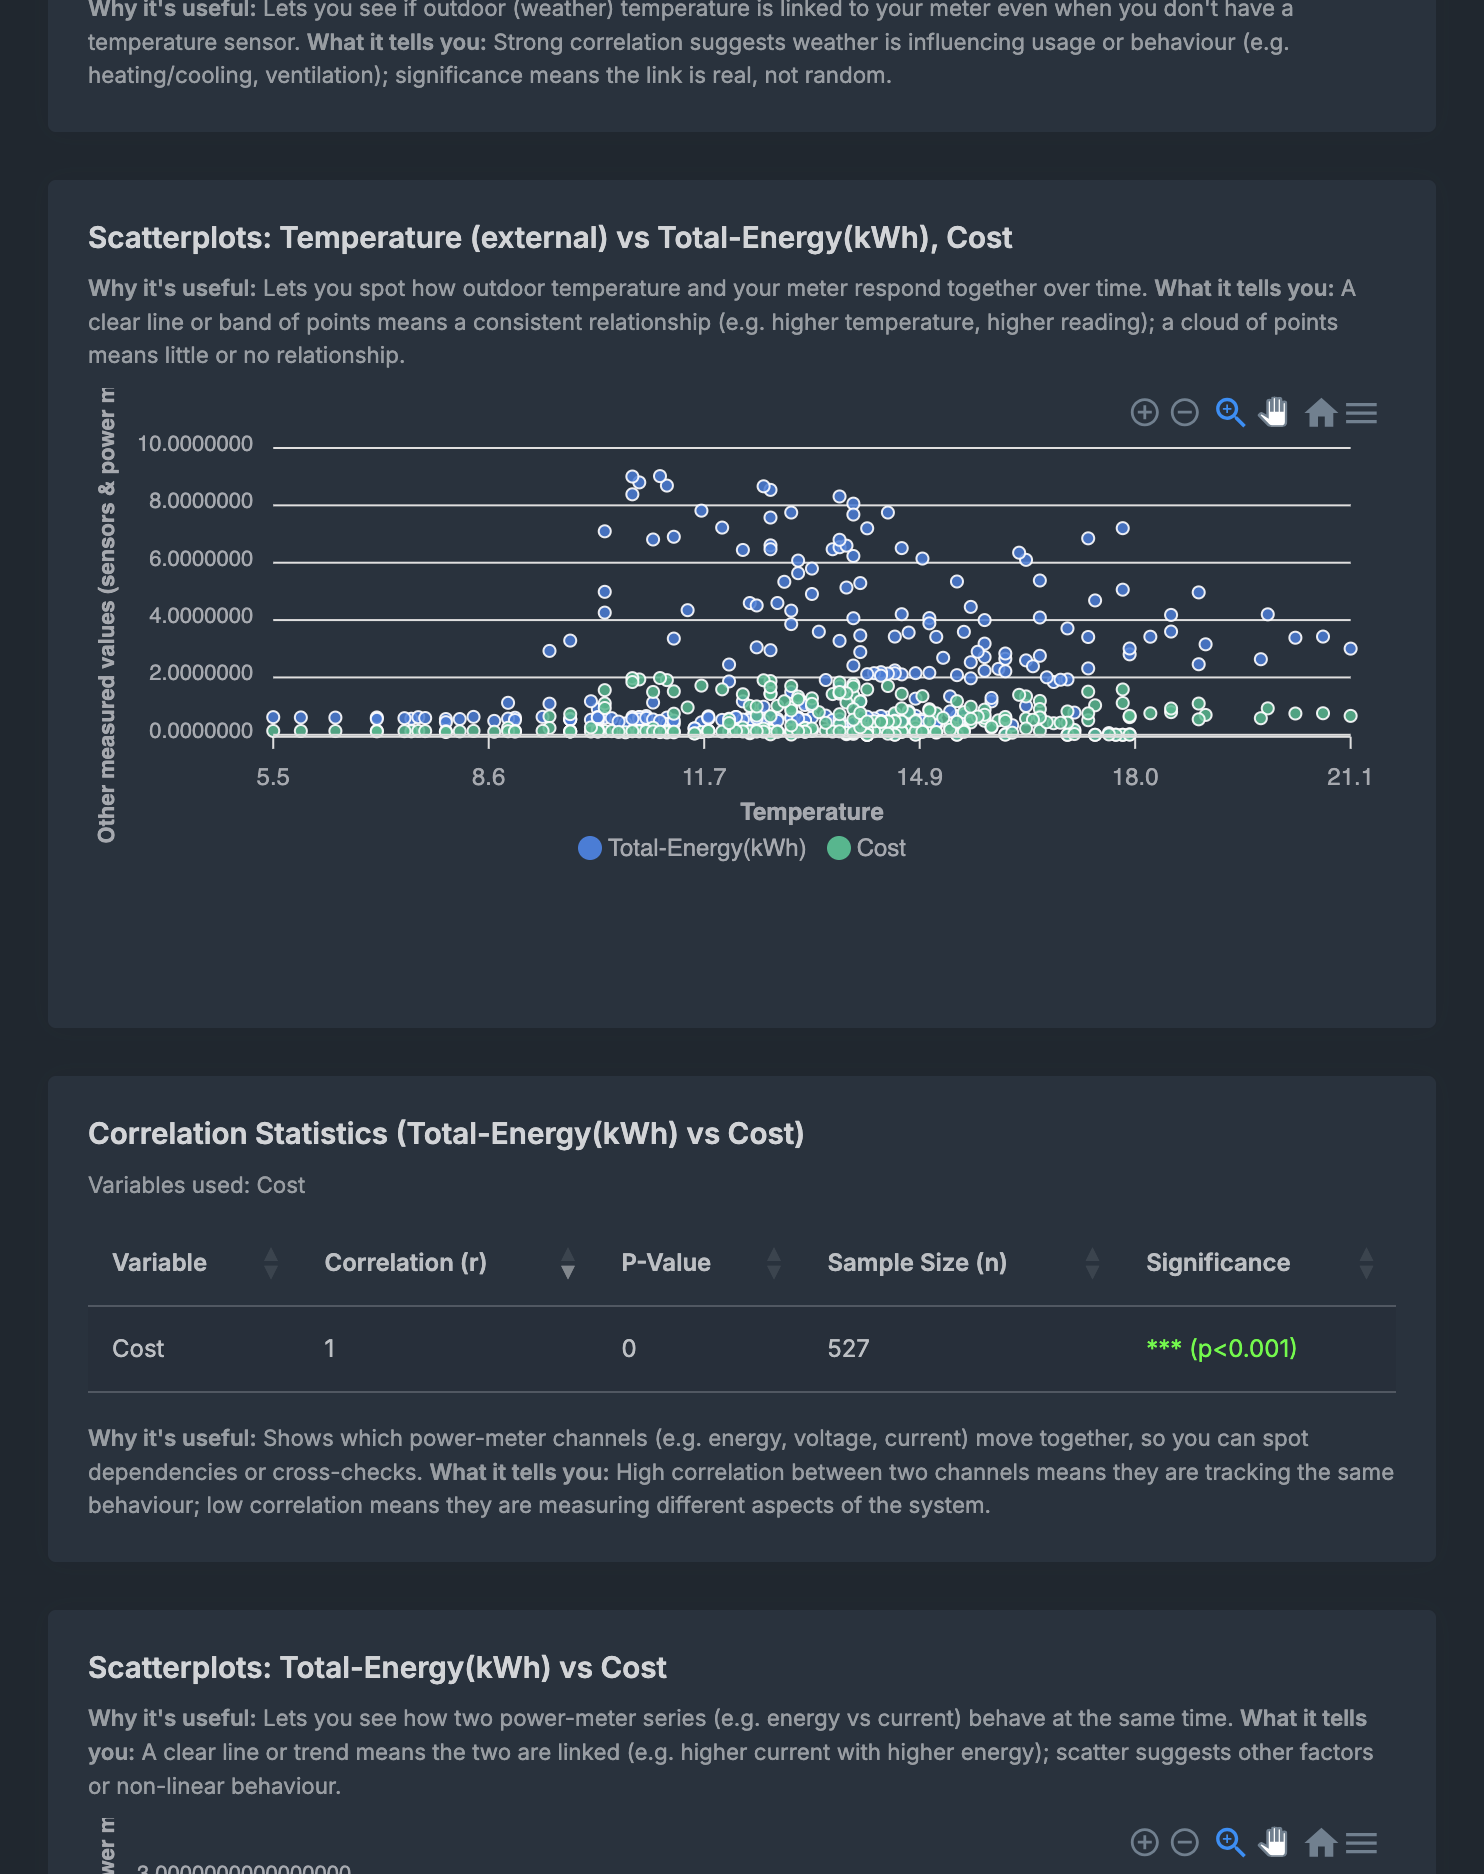
Explain the spikes
Automatic correlation and scatter analysis against temperature, rainfall and wind — with significance scoring — even without a local sensor.
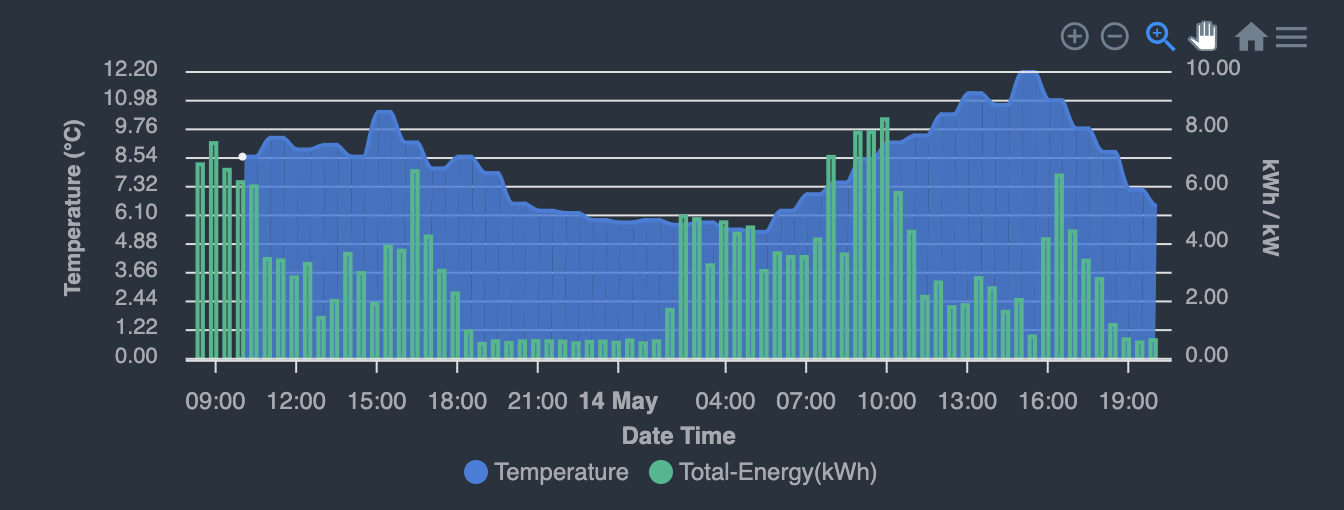
See the weather behind the load
Hourly outdoor temperature plotted against your consumption — so you can see how heating and cooling demand tracks the weather, even without a sensor on site.
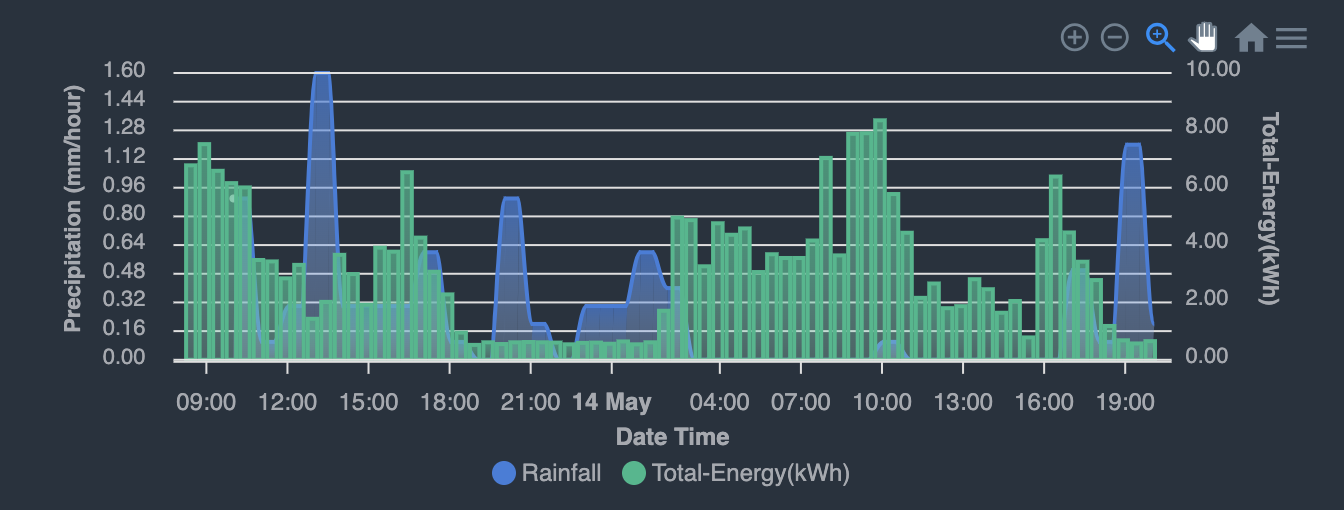
Rule weather in — or out
Hourly precipitation plotted alongside usage helps explain unexpected spikes and dips, and tells you when the weather — not a fault — is driving consumption.
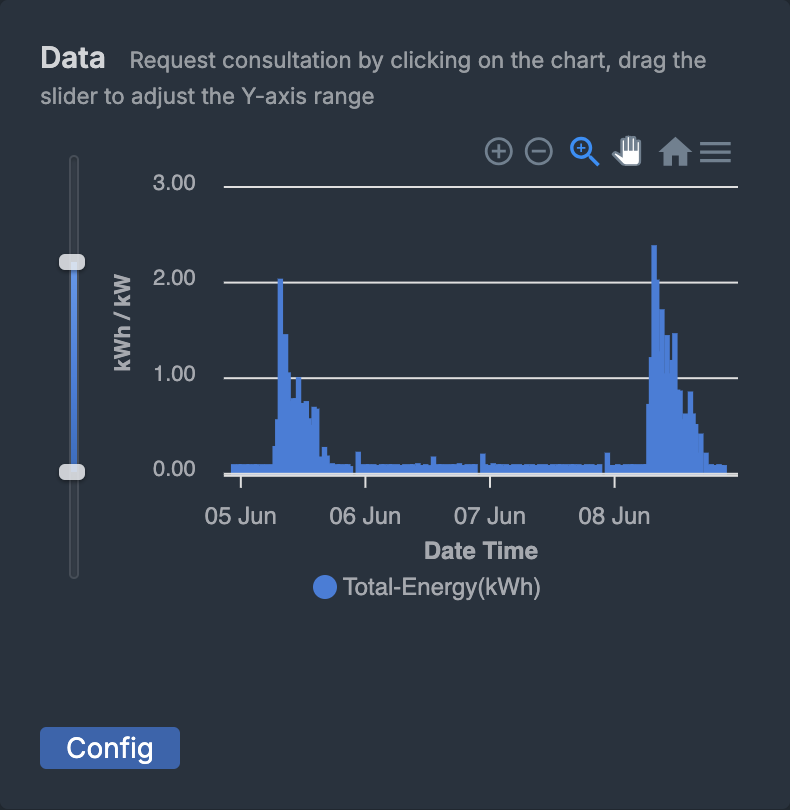
Drill into any sub-meter
Every meter — right down to a single sub-let or nursery supply — has its own half-hourly profile and live readings, ready to export.
Designed & built in the UK
An end-to-end range that brings the information you need from your site to where you can use it — from the meter on the wall to the dashboard on your screen.
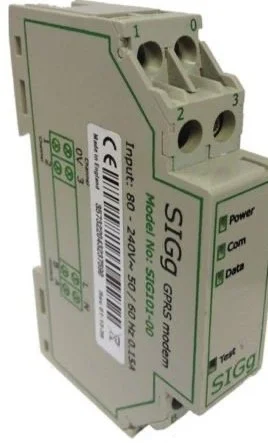
SIG Insight
Real-time access to utilities, energy and carbon data — so customers understand their energy use and make informed decisions to reduce cost and save carbon.
- Monitors any kind of utility
- Sends data remotely over mobile networks
- DIN-rail integrated to cut maintenance
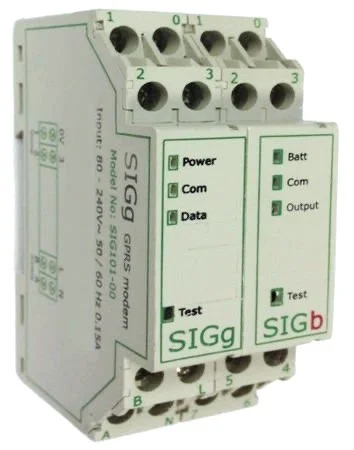
SIG Control
Everything in SIG Insight, plus the ability to control energy assets — with battery back-up for increased operational flexibility and the ability to respond to events.
- Remotely control any electrical appliance
- Set-rule or AI-driven dynamic control
- Battery back-up for resilience
Any utility. Any age of building.
Retrofitted hardware works with existing plant and meters — no rip-and-replace required.
Electricity
Mains, sub-meters and sub-let areas — down to half-hourly.
Gas
Boilers and heating plant — catch out-of-hours running.
Water
Consumption monitoring and leak / anomaly detection.
Solar PV
Generation & performance — flag underperforming arrays.
Not just a dashboard — a partner that acts
Software shows you the problem. We find it, fix it and keep it fixed — with one in-house team from survey to savings.
One team, end to end
Our own engineers survey, install, monitor and fix — no chasing third parties, no finger-pointing between vendors.
Works with what you have
Retrofitted to plant and meters of any age. No rip-and-replace, no forced BMS programme — start saving on the estate you already run.
Multi-sector specialists
Proven across thousands of homes, factories, schools and offices — to name a few. We speak the language of owners, finance and operations teams — and the data lands ready for net-zero reporting.
Evidence-led savings
Every recommendation is backed by half-hourly data with the £ impact attached — so spend is justified and savings are measurable.
Monitoring that pays for itself
These savings were surfaced on live sites — exactly the kind of waste estates miss without sub-hourly, multi-utility data.
PV fault, high voltage & sub-let waste
- Solar array fault identified from generation data
- Incoming high voltage flagged for remediation
- Sub-let weekend/holiday electric use addressed
Boilers left running out of hours
- High weekend gas consumption detected
- Heating schedule corrected against real demand
- Ongoing exception alerts to prevent recurrence
Scales from a single building to a whole estate
Homes, factories, schools, offices and multi-site estates — to name a few. Whether it's one building or dozens across several locations, SIG scales without forcing a single BMS or boiler-replacement programme — giving owners, finance and operations teams the evidence for budgets, sustainability reporting and capital prioritisation.

Finance & senior leadership
Estate-wide trends, automated monthly reports, and tariff & procurement insight.
Owners & site managers
Site-level dashboards and exception alerts, accessible from any device.
Facilities & premises
Weekend & holiday consumption, plant faults, and accurate sub-let billing.
Sustainability & net zero
Clear, shared data for leadership, boards and carbon reporting.
Simple for busy teams
We handle the engineering end to end — you get the information and the savings.
Survey & design
Our engineers assess meters, plant and sub-let layout, and retrofit hardware where needed.
Connect & portal
Live data flows into SIG, with roles for finance, estates and site leads.
Report & alert
Bespoke monthly reports plus exception emails for spikes and anomalies.
Act & save
Our in-house team fixes plant, optimises tariffs and installs further savings measures.
Everything you need to know
Short answers to what estates, finance teams and facilities managers ask us most.
Do we have to replace our existing meters or plant?
No. SIG retrofits monitoring and control hardware onto your existing meters and plant — whatever the age. There's no rip-and-replace and no need for a full BMS or boiler-replacement programme to get started.
Which utilities can you monitor?
Electricity (mains, sub-meters and sub-let areas), gas, water and solar PV generation — all side by side in SIG, down to half-hourly resolution.
How quickly will we see savings?
Many sites surface quick wins within weeks — out-of-hours plant, weekend heating, sub-let waste and underperforming solar. Across live sites we've identified savings of up to 40% of energy spend.
Can it scale across multiple sites or a large estate?
Yes. SIG runs from a single home or building to an estate of dozens of sites across several locations, with role-based access for finance, operations and site teams and a geographic map of every location.
Who manages the installation?
We do, end to end. Our own engineers survey, design and retrofit the hardware, connect the data into the portal, then deliver monthly reports and exception alerts — and act on the findings.
Is our data secure and accessible to the right people?
Access is role-based, so finance, estates, site managers and governance each see what they need from any web-enabled device — with data ready for net-zero and sustainability reporting.
Ready to see what your estate is really using?
Book a no-obligation review and our engineers will scope a pilot site or a trust-wide rollout from your existing meters and plant. No rip-and-replace required.
- A review of your meters, plant & tariffs — at no cost
- Quick-win savings opportunities flagged from real data
- A clear scope for a pilot or estate-wide rollout